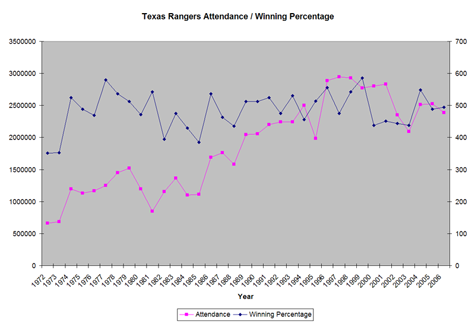
In an idea that I admit I completely ripped off from the USS Mariner Site, I went through my attendance history page, and entered the data into Excel. I produced a graph that shows how the attendance records and the winning percentage go over time. I went from 1972-2006. I do have the records from the Washington Senators, years, but I did not include them.
Whenever we hear from the Rangers that there’s too many empty seats, someone will almost invariably follow that up with a statement saying “Well, if you win, people will come”. Yes, that’s true, but it’s also true this is Cowboy land. Some people are loathe to deal with the Rangers. Newy Scruggs over at NBC5 for one. You can almost see the pain on his face when he has to talk baseball. But that’s a rant for another time. I decided to look at the numbers and see how this all breaks down. Take a look below. I have a few larger size images for you to check out besides this thumbnail here. You can also download my Excel spreadsheet if you’re so inclined to look at it that way. I’d be curious to see what you think of this – please leave some comments below. Thanks.

I think it’s interesting how the Johnny Oates era brought so much attendance and then it was also interesting how the 2004 year didn’t bring as many people in as those years in the late 90’s.